Torque 2024 - 1 turbine cases#
The following analytical wake models are included in FLORIS, FOXES, and PyWake.
Velocity Models
Wake Model |
FLORIS |
FOXES |
PyWake |
|---|---|---|---|
Jensen 1983 |
• |
• |
• |
Larson 2009 |
• |
||
Bastankhah / Porte Agel 2014 |
• |
• |
|
Bastankhah / Porte Agel 2016 |
• |
• |
|
Niayifar / Porté-Agel 2016 |
• |
||
IEA Task37 Bastankhah 2018 |
• |
||
Carbajo Fuertes / Markfort / Porté-Agel 2018 |
• |
||
Blondel / Cathelain 2020 |
• |
||
Zong / Porté-Agel 2020 |
• |
||
Cumulative Curl 2022 |
• |
||
TurbOPark (Nygaard 2022) |
•* |
• |
• |
Empirical Gauss 2023 |
• |
Deflection Models
Wake Model |
FLORIS |
FOXES |
PyWake |
|---|---|---|---|
Jímenez 2010 |
• |
• |
|
Bastankhah / Porté-Agel 2016 |
• |
• |
|
Larsen et al 2020 |
• |
||
Empirical Gauss 2023 |
• |
# stdlib
from pathlib import Path
import matplotlib.pyplot as plt
import numpy as np

# wcomp
from wcomp import WCompFloris, WCompPyWake, WCompFoxes
from wcomp.plotting import plot_plane

# plot settings
PROFILE_LINEWIDTH = 1.0
ERROR_LINEWIDTH = 1.5

SMALL_SIZE = 12
MEDIUM_SIZE = 14
BIGGER_SIZE = 16
# plt.rc('font', size=SMALL_SIZE)          # controls default text sizes
plt.rc('xtick', labelsize=SMALL_SIZE)    # fontsize of the tick labels
plt.rc('ytick', labelsize=SMALL_SIZE)    # fontsize of the tick labels
plt.rc('axes', labelsize=MEDIUM_SIZE)
plt.rc('axes', titlesize=BIGGER_SIZE)
plt.rc('legend', fontsize=MEDIUM_SIZE)
plt.rc('figure', titlesize=BIGGER_SIZE)

# Constants for all cases. Copy to a particular code block to change, as needed.
CASE_DIR = Path('cases_torque2024/one_turbine')
this_case = CASE_DIR / Path('jensen/wind_energy_system.yaml')
floris_case = WCompFloris(this_case)
ROTOR_D = floris_case.rotor_diameter
XMIN = -1 * ROTOR_D
XMAX = 20 * ROTOR_D
YMIN = -2 * ROTOR_D
YMAX =  2 * ROTOR_D

SAVE_FIGS = False
SAVE_PATH = Path('figures')
if SAVE_FIGS:
    SAVE_PATH.mkdir(exist_ok=True)
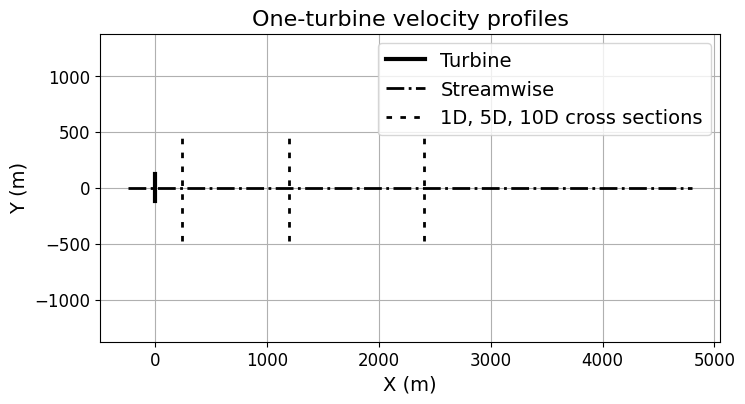
Case Layout#
x_turbine = np.array([0.0, 0.0])
y_turbine = np.array([-ROTOR_D/2, ROTOR_D/2])
x_streamwise = np.array([XMIN, XMAX])
y_streamwise = np.array([0.0, 0.0])
x_1d = np.array([1 * ROTOR_D, 1 * ROTOR_D])
x_5d = np.array([5 * ROTOR_D, 5 * ROTOR_D])
x_10d = np.array([10 * ROTOR_D, 10 * ROTOR_D])
y_crosswise = np.array([YMIN, YMAX])
fig, ax = plt.subplots(figsize=(8, 4))
ax.plot(x_turbine, y_turbine, '-', color='black', linewidth=3, label="Turbine")
ax.plot(x_streamwise, y_streamwise, '-.', color='black', linewidth=2, label="Streamwise")
ax.plot(x_1d, y_crosswise, linestyle=(0, (2, 3)), color='black', linewidth=2)
ax.plot(x_5d, y_crosswise, linestyle=(0, (2, 3)), color='black', linewidth=2)
ax.plot(x_10d, y_crosswise, linestyle=(0, (2, 3)), color='black', linewidth=2, label="1D, 5D, 10D cross sections")
ax.set_title("One-turbine velocity profiles")
ax.set_xlabel("X (m)")
ax.set_ylabel("Y (m)")
ax.set_ylim([-1000, 1000])
ax.axis('equal')
ax.grid()
ax.legend()

if SAVE_FIGS: fig.savefig(SAVE_PATH / Path('1t config.png'))
Velocity models#
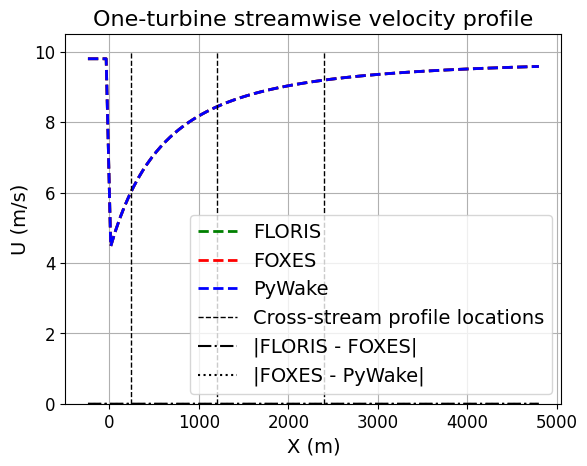
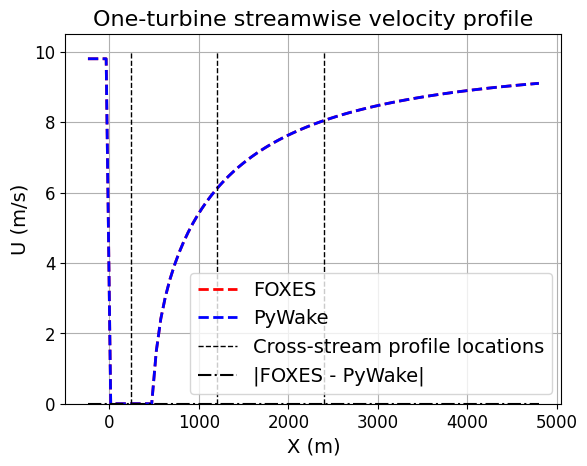
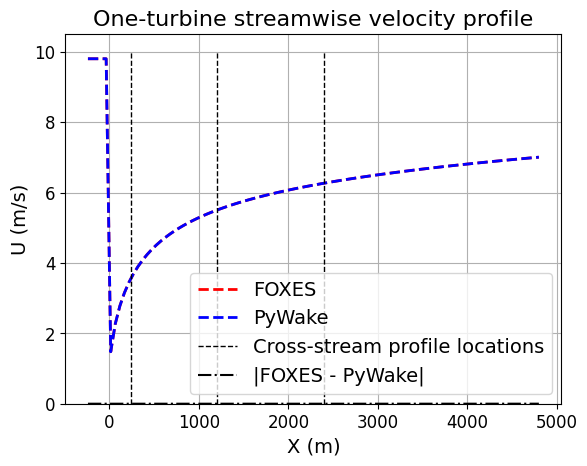
Jensen#
This is the Jensen model as described in the paper: A note on wind generator interaction (1983) https://backend.orbit.dtu.dk/ws/portalfiles/portal/55857682/ris_m_2411.pdf
There, the wake width is given as 0.1 on pages 6 and 8. PyWake has 0.1 as default FLORIS has 0.05 as default, but it is changed to 0.1 here. FOXES has a set of predefined Jensen wake models available, but you are expected to create your own, as needed. That is done here with k=0.1.
Implemented in: FLORIS, FOXES, PyWake
this_case = CASE_DIR / Path('jensen/wind_energy_system.yaml')
floris_case = WCompFloris(this_case)
foxes_case = WCompFoxes(this_case)
pywake_case = WCompPyWake(this_case)
fig, ax = plt.subplots()
floris_case.streamwise_profile_plot(wind_direction=270, y_coordinate=0.0, xmin=XMIN, xmax=XMAX)
foxes_case.streamwise_profile_plot(wind_direction=270, y_coordinate=0.0, xmin=XMIN, xmax=XMAX)
pywake_case.streamwise_profile_plot(wind_direction=270, y_coordinate=0.0, xmin=XMIN, xmax=XMAX)
ax.plot([1*ROTOR_D, 1*ROTOR_D], [0, 10], color="black", linestyle='--', linewidth=PROFILE_LINEWIDTH)
ax.plot([5*ROTOR_D, 5*ROTOR_D], [0, 10], color="black", linestyle='--', linewidth=PROFILE_LINEWIDTH)
ax.plot([10*ROTOR_D, 10*ROTOR_D], [0, 10], color="black", linestyle='--', linewidth=PROFILE_LINEWIDTH, label="Cross-stream profile locations")
lines = ax.lines
x1, y1 = lines[0].get_data()
x2, y2 = lines[1].get_data()
x3, y3 = lines[2].get_data()
e1 = np.abs(y1 - y2)
e2 = np.abs(y2 - y3)
ax.plot(x1, e1, color="black", linestyle='-.', linewidth=ERROR_LINEWIDTH, label="|FLORIS - FOXES|")
ax.plot(x1, e2, color="black", linestyle=':', linewidth=ERROR_LINEWIDTH, label="|FOXES - PyWake|")
ax.set_title("One-turbine streamwise velocity profile")
ax.set_xlabel("X (m)")
ax.set_ylabel('U (m/s)')
ax.set_ybound(lower=0.0)
ax.legend()
ax.grid()
if SAVE_FIGS: fig.savefig(SAVE_PATH / Path('jensen 1t x.png'))
print("Error norm:")
print(np.linalg.norm(e1, ord=2))
print(np.linalg.norm(e2, ord=2))
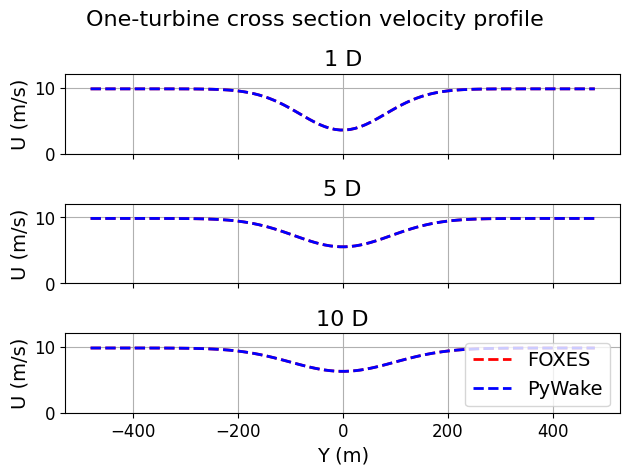
fig, ax = plt.subplots(3, 1)
fig.suptitle("One-turbine cross section velocity profile")
X_D = [1, 5, 10]
for i, D_X in enumerate(X_D):
plt.axes(ax[i])
floris_case.xsection_profile_plot(wind_direction=270, x_coordinate=D_X * ROTOR_D, ymin=YMIN, ymax=YMAX)
foxes_case.xsection_profile_plot(wind_direction=270, x_coordinate=D_X * ROTOR_D, ymin=YMIN, ymax=YMAX)
pywake_case.xsection_profile_plot(wind_direction=270, x_coordinate=D_X * ROTOR_D, ymin=YMIN, ymax=YMAX)
ax[i].set_title(f"{D_X} D")
ax[i].set_ylabel("U (m/s)")
ax[i].set_ybound(lower=0.0, upper=12.0)
ax[i].grid()
if i < len(X_D) - 1:
ax[i].xaxis.set_ticklabels([])
else:
ax[i].set_xlabel("Y (m)")
ax[i].legend()
fig.tight_layout()
if SAVE_FIGS: fig.savefig(SAVE_PATH / Path('jensen 1t y.png'))
Turbine 0, T0: windio_turbine
Error norm:
0.0004949684635964407
7.049697655142648e-15
Bastankhah / Porte Agel 2014#
A new analytical model for wind-turbine wakes https://www.sciencedirect.com/science/article/abs/pii/S0960148114000317
k*, the wake growth rate d-sigma/dx, is the only parameter
Implemented in: FOXES, PyWake
this_case = CASE_DIR / Path('bastankhah2014/wind_energy_system.yaml')
# floris_case = WCompFloris(this_case)  # Not implemented
foxes_case = WCompFoxes(this_case)
pywake_case = WCompPyWake(this_case)

fig, ax = plt.subplots()
# floris_case.streamwise_profile_plot(wind_direction=270, y_coordinate=0.0, xmin=XMIN, xmax=XMAX)
foxes_case.streamwise_profile_plot(wind_direction=270, y_coordinate=0.0, xmin=XMIN, xmax=XMAX)
pywake_case.streamwise_profile_plot(wind_direction=270, y_coordinate=0.0, xmin=XMIN, xmax=XMAX)
ax.plot([1*ROTOR_D, 1*ROTOR_D], [0, 10], color="black", linestyle='--', linewidth=PROFILE_LINEWIDTH)
ax.plot([5*ROTOR_D, 5*ROTOR_D], [0, 10], color="black", linestyle='--', linewidth=PROFILE_LINEWIDTH)
ax.plot([10*ROTOR_D, 10*ROTOR_D], [0, 10], color="black", linestyle='--', linewidth=PROFILE_LINEWIDTH, label="Cross-stream profile locations")
lines = ax.lines
x1, y1 = lines[0].get_data()
x2, y2 = lines[1].get_data()
e1 = np.abs(y1 - y2)
ax.plot(x1, e1, color="black", linestyle='-.', linewidth=ERROR_LINEWIDTH, label="|FOXES - PyWake|")
ax.set_title("One-turbine streamwise velocity profile")
ax.set_xlabel("X (m)")
ax.set_ylabel('U (m/s)')
ax.set_ybound(lower=0.0)
ax.legend()
ax.grid()
if SAVE_FIGS: fig.savefig(SAVE_PATH / Path('b2014 1t x.png'))

print("Error norm:")
print(np.linalg.norm(e1, ord=2))


fig, ax = plt.subplots(3, 1)
fig.suptitle("One-turbine cross section velocity profile")
X_D = [1, 5, 10]
for i, D_X in enumerate(X_D):
    plt.axes(ax[i])
    # floris_case.xsection_profile_plot(wind_direction=270, x_coordinate=D_X * ROTOR_D, ymin=YMIN, ymax=YMAX)
    foxes_case.xsection_profile_plot(wind_direction=270, x_coordinate=D_X * ROTOR_D, ymin=YMIN, ymax=YMAX)
    pywake_case.xsection_profile_plot(wind_direction=270, x_coordinate=D_X * ROTOR_D, ymin=YMIN, ymax=YMAX)
    ax[i].set_title(f"{D_X} D")
    ax[i].set_ylabel("U (m/s)")
    ax[i].set_ybound(lower=0.0, upper=12.0)
    ax[i].grid()
    if i < len(X_D) - 1:
        ax[i].xaxis.set_ticklabels([])
    else:
        ax[i].set_xlabel("Y (m)")
        ax[i].legend()
fig.tight_layout()
if SAVE_FIGS: fig.savefig(SAVE_PATH / Path('b2014 1t y.png'))
Turbine 0, T0: windio_turbine
Error norm:
2.560358201968351e-14
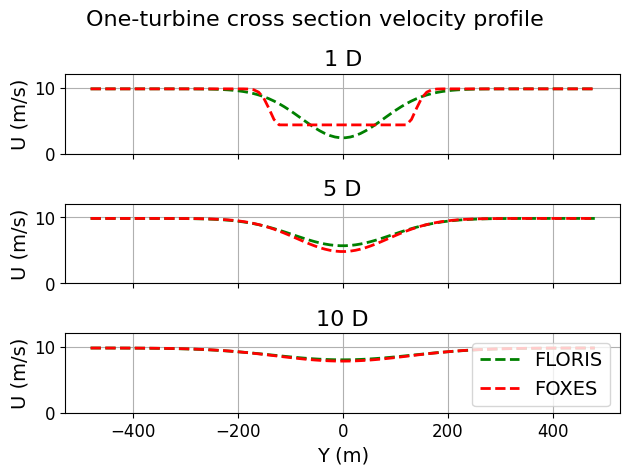
Bastankhah / Porte Agel 2016#
Experimental and theoretical study of wind turbine wakes in yawed conditions https://www.cambridge.org/core/journals/journal-of-fluid-mechanics/article/experimental-and-theoretical-study-of-wind-turbine-wakes-in-yawed-conditions/400859134E38F340C8811FD7AAD0CE05
ky, kz are wake growth rates in the y and z directions Eq 6.16 has parameters alpha and beta and below says that they are 0.58 and 0.077. Equations 7.1 - 7.4 summarize the model but use parameters alpha_star and beta_star, which are 2.32 and 0.154. These are related to alpha and beta by:
alpha_star = 4 * alpha = 4 * 0.58 = 2.32
beta_star = 2 * beta = 2 * 0.077 = 0.154
In the near wake, the distribution away from the wake centerline is given by 6.13.
Implemented in: FOXES, PyWake
NOTE: k is set to 0.022 as mentioned in the last paragraph of section 4.
NOTE: FLORIS has ky and kz parameters, but FOXES uses the same, k, for both. This simplification is mentioned in the paper in section 7 Model Predictions. For simplicity, FLORIS uses k for both ky and kz.
NOTE: FLORIS sets ky and kz in the deflection model based on Eq 15 from Niayifar / Porte Agel 2016 https://www.mdpi.com/1996-1073/9/9/741 ky = kz = ka * I + kb ka = 0.3837 kb = 0.003678 Where as Bastankhah / Porte Agel 2016 sets ky and kz directly as in the velocity model.
this_case = CASE_DIR / Path('bastankhah2016/wind_energy_system.yaml')
floris_case = WCompFloris(this_case)
foxes_case = WCompFoxes(this_case)
# pywake_case = WCompPyWake(this_case)

fig, ax = plt.subplots()
floris_case.streamwise_profile_plot(wind_direction=270, y_coordinate=0.0, xmin=XMIN, xmax=XMAX)
foxes_case.streamwise_profile_plot(wind_direction=270, y_coordinate=0.0, xmin=XMIN, xmax=XMAX)
# pywake_case.streamwise_profile_plot(wind_direction=270, y_coordinate=0.0, xmin=XMIN, xmax=XMAX)
ax.plot([1*ROTOR_D, 1*ROTOR_D], [0, 10], color="black", linestyle='--', linewidth=PROFILE_LINEWIDTH)
ax.plot([5*ROTOR_D, 5*ROTOR_D], [0, 10], color="black", linestyle='--', linewidth=PROFILE_LINEWIDTH)
ax.plot([10*ROTOR_D, 10*ROTOR_D], [0, 10], color="black", linestyle='--', linewidth=PROFILE_LINEWIDTH, label="Cross-stream profile locations")
lines = ax.lines
x1, y1 = lines[0].get_data()
x2, y2 = lines[1].get_data()
e1 = np.abs(y1 - y2)
ax.plot(x1, e1, color="black", linestyle='-.', linewidth=ERROR_LINEWIDTH, label="|FLORIS - FOXES|")
ax.set_title("One-turbine streamwise velocity profile")
ax.set_xlabel("X (m)")
ax.set_ylabel('U (m/s)')
ax.set_ybound(lower=0.0)
ax.legend()
ax.grid()
if SAVE_FIGS: fig.savefig(SAVE_PATH / Path('b2016 1t x.png'))

print("Error norm:")
print(np.linalg.norm(e1, ord=2))


fig, ax = plt.subplots(3, 1)
fig.suptitle("One-turbine cross section velocity profile")
X_D = [1, 5, 10]
for i, D_X in enumerate(X_D):
    plt.axes(ax[i])
    floris_case.xsection_profile_plot(wind_direction=270, x_coordinate=D_X * ROTOR_D, ymin=YMIN, ymax=YMAX)
    foxes_case.xsection_profile_plot(wind_direction=270, x_coordinate=D_X * ROTOR_D, ymin=YMIN, ymax=YMAX)
    # pywake_case.xsection_profile_plot(wind_direction=270, x_coordinate=D_X * ROTOR_D, ymin=YMIN, ymax=YMAX)
    ax[i].set_title(f"{D_X} D")
    ax[i].set_ylabel("U (m/s)")
    ax[i].set_ybound(lower=0.0, upper=12.0)
    ax[i].grid()
    if i < len(X_D) - 1:
        ax[i].xaxis.set_ticklabels([])
    else:
        ax[i].set_xlabel("Y (m)")
        ax[i].legend()
fig.tight_layout()
if SAVE_FIGS: fig.savefig(SAVE_PATH / Path('b2016 1t y.png'))
Turbine 0, T0: windio_turbine
Error norm:
7.706554870684573

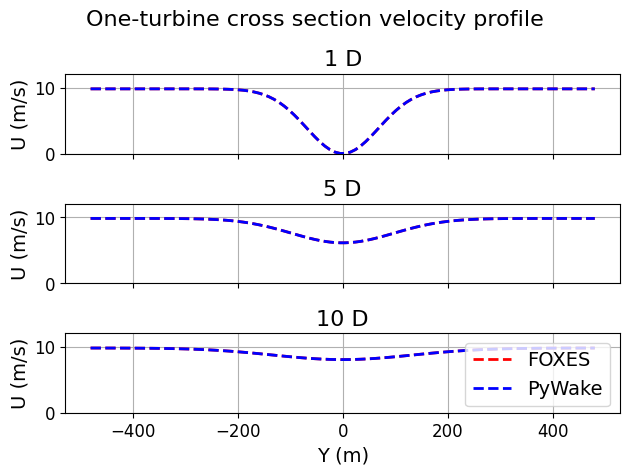
TurbOPark#
Modelling cluster wakes and wind farm blockage https://iopscience.iop.org/article/10.1088/1742-6596/1618/6/062072
The only parameter is A with value = 0.04
Implemented in: FLORIS, FOXES, PyWake, but FLORIS doesn't support plotting so it's excluded.
this_case = CASE_DIR / Path('turbopark/wind_energy_system.yaml')
# floris_case = WCompFloris(this_case)
foxes_case = WCompFoxes(this_case)
pywake_case = WCompPyWake(this_case)

fig, ax = plt.subplots()
# floris_case.streamwise_profile_plot(wind_direction=270, y_coordinate=0.0, xmin=XMIN, xmax=XMAX)
foxes_case.streamwise_profile_plot(wind_direction=270, y_coordinate=0.0, xmin=XMIN, xmax=XMAX)
pywake_case.streamwise_profile_plot(wind_direction=270, y_coordinate=0.0, xmin=XMIN, xmax=XMAX)
ax.plot([1*ROTOR_D, 1*ROTOR_D], [0, 10], color="black", linestyle='--', linewidth=PROFILE_LINEWIDTH)
ax.plot([5*ROTOR_D, 5*ROTOR_D], [0, 10], color="black", linestyle='--', linewidth=PROFILE_LINEWIDTH)
ax.plot([10*ROTOR_D, 10*ROTOR_D], [0, 10], color="black", linestyle='--', linewidth=PROFILE_LINEWIDTH, label="Cross-stream profile locations")
lines = ax.lines
x1, y1 = lines[0].get_data()
x2, y2 = lines[1].get_data()
e1 = np.abs(y1 - y2)
ax.plot(x1, e1, color="black", linestyle='-.', linewidth=ERROR_LINEWIDTH, label="|FOXES - PyWake|")
ax.set_title("One-turbine streamwise velocity profile")
ax.set_xlabel("X (m)")
ax.set_ylabel('U (m/s)')
ax.set_ybound(lower=0.0)
ax.legend()
ax.grid()
if SAVE_FIGS: fig.savefig(SAVE_PATH / Path('turbopark 1t x.png'))

print("Error norm:")
print(np.linalg.norm(e1, ord=2))


fig, ax = plt.subplots(3, 1)
fig.suptitle("One-turbine cross section velocity profile")
X_D = [1, 5, 10]
for i, D_X in enumerate(X_D):
    plt.axes(ax[i])
    # floris_case.xsection_profile_plot(wind_direction=270, x_coordinate=D_X * ROTOR_D, ymin=YMIN, ymax=YMAX)
    foxes_case.xsection_profile_plot(wind_direction=270, x_coordinate=D_X * ROTOR_D, ymin=YMIN, ymax=YMAX)
    pywake_case.xsection_profile_plot(wind_direction=270, x_coordinate=D_X * ROTOR_D, ymin=YMIN, ymax=YMAX)
    ax[i].set_title(f"{D_X} D")
    ax[i].set_ylabel("U (m/s)")
    ax[i].set_ybound(lower=0.0, upper=12.0)
    ax[i].grid()
    if i < len(X_D) - 1:
        ax[i].xaxis.set_ticklabels([])
    else:
        ax[i].set_xlabel("Y (m)")
        ax[i].legend()
fig.tight_layout()
if SAVE_FIGS: fig.savefig(SAVE_PATH / Path('turbopark 1t y.png'))
Turbine 0, T0: windio_turbine
Error norm:
0.00305260291072107
Wake deflection models#
Here we yaw the turbines 10 degrees to activate the wake deflection models.
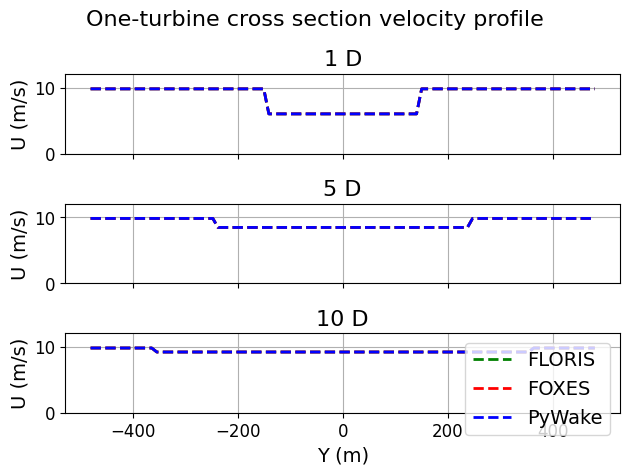
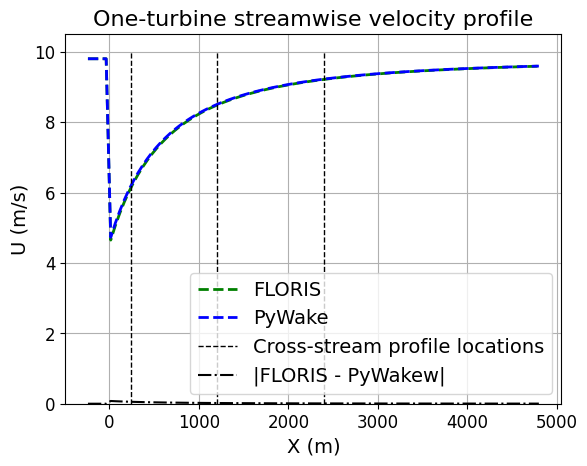
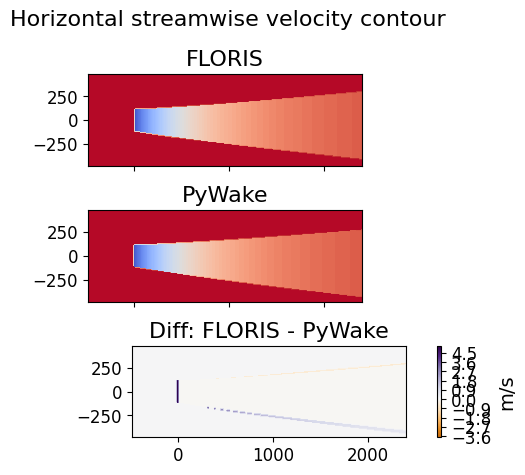
Jimenez#
Application of a LES technique to characterize the wake deflection of a wind turbine in yaw https://onlinelibrary.wiley.com/doi/10.1002/we.380
Using the Jensen velocity deficit model, we compare the Jimenez deflection models.
beta is the only parameter, and the paper suggest values between 0.9 and 0.125. We use 0.1.
NOTE: The FLORIS implementation does not correlate to the paper, and there are additional parameters. ad, bd are default to 0 so that was left. I've set kd to beta.
Implemented in: FLORIS and PyWake
this_case = CASE_DIR / Path('jimenez/wind_energy_system.yaml')
floris_case = WCompFloris(this_case)
# foxes_case = WCompFoxes(this_case)
pywake_case = WCompPyWake(this_case)
fig, ax = plt.subplots()
floris_case.streamwise_profile_plot(wind_direction=270, y_coordinate=0.0, xmin=XMIN, xmax=XMAX)
# foxes_case.streamwise_profile_plot(wind_direction=270, y_coordinate=0.0, xmin=XMIN, xmax=XMAX)
pywake_case.streamwise_profile_plot(wind_direction=270, y_coordinate=0.0, xmin=XMIN, xmax=XMAX)
ax.plot([1*ROTOR_D, 1*ROTOR_D], [0, 10], color="black", linestyle='--', linewidth=PROFILE_LINEWIDTH)
ax.plot([5*ROTOR_D, 5*ROTOR_D], [0, 10], color="black", linestyle='--', linewidth=PROFILE_LINEWIDTH)
ax.plot([10*ROTOR_D, 10*ROTOR_D], [0, 10], color="black", linestyle='--', linewidth=PROFILE_LINEWIDTH, label="Cross-stream profile locations")
lines = ax.lines
x1, y1 = lines[0].get_data()
x2, y2 = lines[1].get_data()
e1 = np.abs(y1 - y2)
ax.plot(x1, e1, color="black", linestyle='-.', linewidth=ERROR_LINEWIDTH, label="|FLORIS - PyWakew|")
ax.set_title("One-turbine streamwise velocity profile")
ax.set_xlabel("X (m)")
ax.set_ylabel('U (m/s)')
ax.set_ybound(lower=0.0)
ax.legend()
ax.grid()
if SAVE_FIGS: fig.savefig(SAVE_PATH / Path('jimenez 1t x.png'))
print("Error norm:")
print(np.linalg.norm(e1, ord=2))
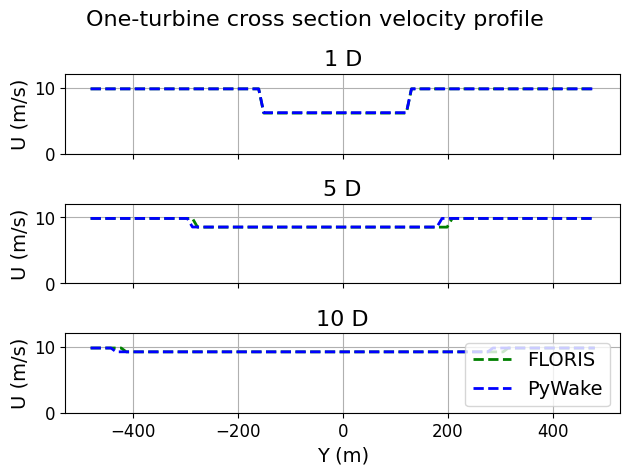
fig, ax = plt.subplots(3, 1)
fig.suptitle("One-turbine cross section velocity profile")
X_D = [1, 5, 10]
for i, D_X in enumerate(X_D):
plt.axes(ax[i])
floris_case.xsection_profile_plot(wind_direction=270, x_coordinate=D_X * ROTOR_D, ymin=YMIN, ymax=YMAX)
# foxes_case.xsection_profile_plot(wind_direction=270, x_coordinate=D_X * ROTOR_D, ymin=YMIN, ymax=YMAX)
pywake_case.xsection_profile_plot(wind_direction=270, x_coordinate=D_X * ROTOR_D, ymin=YMIN, ymax=YMAX)
ax[i].set_title(f"{D_X} D")
ax[i].set_ylabel("U (m/s)")
ax[i].set_ybound(lower=0.0, upper=12.0)
ax[i].grid()
if i < len(X_D) - 1:
ax[i].xaxis.set_ticklabels([])
else:
ax[i].set_xlabel("Y (m)")
ax[i].legend()
fig.tight_layout()
if SAVE_FIGS: fig.savefig(SAVE_PATH / Path('jimenez 1t y.png'))
fig, ax = plt.subplots(3, 1)
fig.suptitle("Horizontal streamwise velocity contour")
plt.axes(ax[0])
ax[0].xaxis.set_ticklabels([])
floris_plane = floris_case.horizontal_contour(wind_direction=270)
ax[0].set_title("FLORIS")
# plt.axes(ax[1])
# ax[1].xaxis.set_ticklabels([])
# # foxes_plane = foxes_case.horizontal_contour(wind_direction=270)
plt.axes(ax[1])
ax[1].xaxis.set_ticklabels([])
pywake_plane = pywake_case.horizontal_contour(wind_direction=270)
ax[1].set_title("PyWake")
# fig, ax = plt.subplots(2, 1)
# fig, ax = plt.subplots(1, 1); ax=[ax]
# fig.suptitle("FLORIS - PyWake")
plt.axes(ax[2])
diff = floris_plane - pywake_plane
abs_diff = np.abs(diff.values)
min_speed = -1 * np.max(abs_diff)
max_speed = np.max(abs_diff)
plot_plane(
diff,
min_speed=min_speed,
max_speed=max_speed,
cmap='PuOr',
clevels=100,
color_bar=True,
title="Diff: FLORIS - PyWake"
)
# plt.axes(ax[1])
# diff = floris_plane - foxes_plane
# abs_diff = np.abs(diff.values)
# min_speed = -1 * np.max(abs_diff)
# max_speed = np.max(abs_diff)
# plot_plane(
# diff,
# ax=ax[1],
# min_speed=min_speed,
# max_speed=max_speed,
# cmap='PuOr',
# clevels=100,
# color_bar=True,
# title="FLORIS - FOXES"
# )
fig.tight_layout()
Error norm:
0.22507915331221032
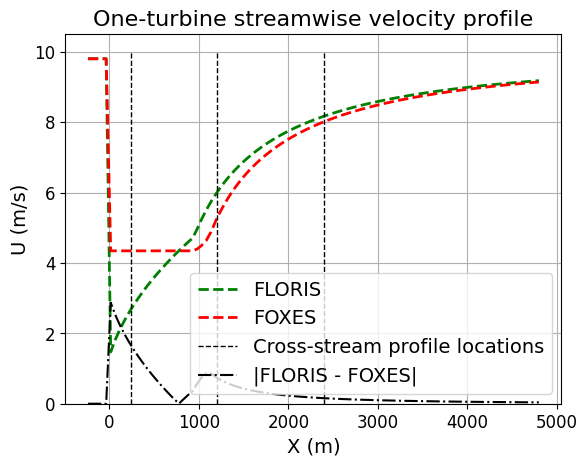
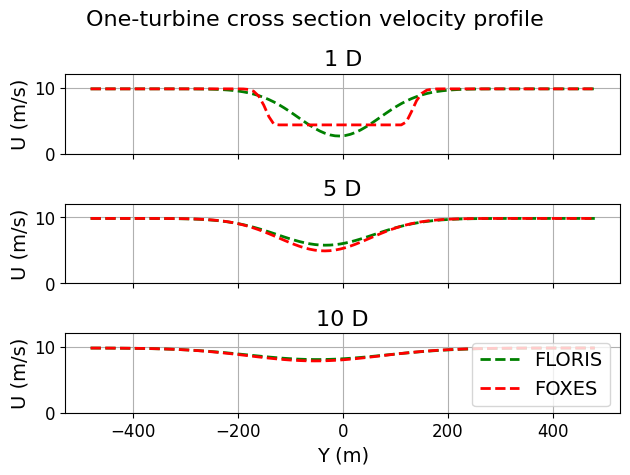
Bastankhah / Porte Agel 2016#
Experimental and theoretical study of wind turbine wakes in yawed conditions https://www.cambridge.org/core/journals/journal-of-fluid-mechanics/article/experimental-and-theoretical-study-of-wind-turbine-wakes-in-yawed-conditions/400859134E38F340C8811FD7AAD0CE05
ky, kz are wake growth rates in the y and z directions Eq 6.16 has parameters alpha and beta and below says that they are 0.58 and 0.077. Equations 7.1 - 7.4 summarize the model but use parameters alpha_star and beta_star, which are 2.32 and 0.154. These are related to alpha and beta by:
alpha_star = 4 * alpha = 4 * 0.58 = 2.32
beta_star = 2 * beta = 2 * 0.077 = 0.154
In the near wake, the distribution away from the wake centerline is given by 6.13.
Implemented in: FLORIS, FOXES PyWake implements the velocity model, but not the deflection model.
NOTE: k is set to 0.022 as mentioned in the last paragraph of section 4.
NOTE: FLORIS sets ky and kz in the deflection model based on Eq 15 from Niayifar / Porte Agel 2016 https://www.mdpi.com/1996-1073/9/9/741 ky = kz = ka * I + kb ka = 0.3837 kb = 0.003678 Where as Bastankhah / Porte Agel 2016 sets ky and kz directly as in the velocity model.
this_case = CASE_DIR / Path('bastankhah2016_deflection/wind_energy_system.yaml')
floris_case = WCompFloris(this_case)
foxes_case = WCompFoxes(this_case)
# pywake_case = WCompPyWake(this_case)
fig, ax = plt.subplots()
floris_case.streamwise_profile_plot(wind_direction=270, y_coordinate=0.0, xmin=XMIN, xmax=XMAX)
foxes_case.streamwise_profile_plot(wind_direction=270, y_coordinate=0.0, xmin=XMIN, xmax=XMAX)
# pywake_case.streamwise_profile_plot(wind_direction=270, y_coordinate=0.0, xmin=XMIN, xmax=XMAX)
ax.plot([1*ROTOR_D, 1*ROTOR_D], [0, 10], color="black", linestyle='--', linewidth=PROFILE_LINEWIDTH)
ax.plot([5*ROTOR_D, 5*ROTOR_D], [0, 10], color="black", linestyle='--', linewidth=PROFILE_LINEWIDTH)
ax.plot([10*ROTOR_D, 10*ROTOR_D], [0, 10], color="black", linestyle='--', linewidth=PROFILE_LINEWIDTH, label="Cross-stream profile locations")
lines = ax.lines
x1, y1 = lines[0].get_data()
x2, y2 = lines[1].get_data()
e1 = np.abs(y1 - y2)
ax.plot(x1, e1, color="black", linestyle='-.', linewidth=ERROR_LINEWIDTH, label="|FLORIS - FOXES|")
ax.set_title("One-turbine streamwise velocity profile")
ax.set_xlabel("X (m)")
ax.set_ylabel('U (m/s)')
ax.set_ybound(lower=0.0)
ax.legend()
ax.grid()
if SAVE_FIGS: fig.savefig(SAVE_PATH / Path('b2016 deflection 1t x.png'))
print("Error norm:")
print(np.linalg.norm(e1, ord=2))
fig, ax = plt.subplots(3, 1)
fig.suptitle("One-turbine cross section velocity profile")
X_D = [1, 5, 10]
for i, D_X in enumerate(X_D):
plt.axes(ax[i])
floris_case.xsection_profile_plot(wind_direction=270, x_coordinate=D_X * ROTOR_D, ymin=YMIN, ymax=YMAX)
foxes_case.xsection_profile_plot(wind_direction=270, x_coordinate=D_X * ROTOR_D, ymin=YMIN, ymax=YMAX)
# pywake_case.xsection_profile_plot(wind_direction=270, x_coordinate=D_X * ROTOR_D, ymin=YMIN, ymax=YMAX)
ax[i].set_title(f"{D_X} D")
ax[i].set_ylabel("U (m/s)")
ax[i].set_ybound(lower=0.0, upper=12.0)
ax[i].grid()
if i < len(X_D) - 1:
ax[i].xaxis.set_ticklabels([])
else:
ax[i].set_xlabel("Y (m)")
ax[i].legend()
fig.tight_layout()
if SAVE_FIGS: fig.savefig(SAVE_PATH / Path('b2016 deflection 1t y.png'))
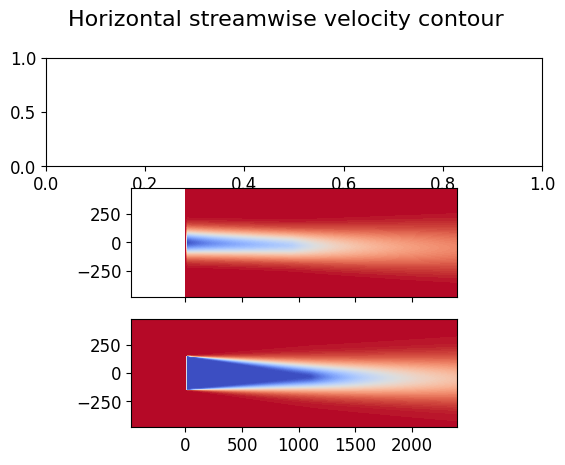
fig, ax = plt.subplots(3, 1)
fig.suptitle("Horizontal streamwise velocity contour")
plt.axes(ax[0])
# ax[0].xaxis.set_ticklabels([])
# pywake_plane = pywake_case.horizontal_contour(wind_direction=270)
plt.axes(ax[1])
ax[1].xaxis.set_ticklabels([])
floris_plane = floris_case.horizontal_contour(wind_direction=270)
plt.axes(ax[2])
ax[1].xaxis.set_ticklabels([])
foxes_plane = foxes_case.horizontal_contour(wind_direction=270)
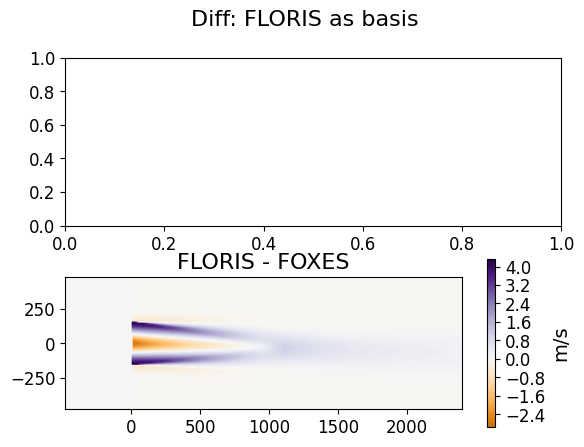
fig, ax = plt.subplots(2, 1)
fig.suptitle("Diff: FLORIS as basis")
plt.axes(ax[0])
# diff = floris_plane - pywake_plane
# abs_diff = np.abs(diff.values)
# min_speed = -1 * np.max(abs_diff)
# max_speed = np.max(abs_diff)
# plot_plane(
# diff,
# ax=ax[0],
# min_speed=min_speed,
# max_speed=max_speed,
# cmap='PuOr',
# clevels=100,
# color_bar=True,
# title="FLORIS - PyWake"
# )
plt.axes(ax[1])
diff = floris_plane - foxes_plane
abs_diff = np.abs(diff.values)
min_speed = -1 * np.max(abs_diff)
max_speed = np.max(abs_diff)
plot_plane(
diff,
min_speed=min_speed,
max_speed=max_speed,
cmap='PuOr',
clevels=100,
color_bar=True,
title="FLORIS - FOXES"
)
Turbine 0, T0: windio_turbine
Error norm:
6.442284281720596
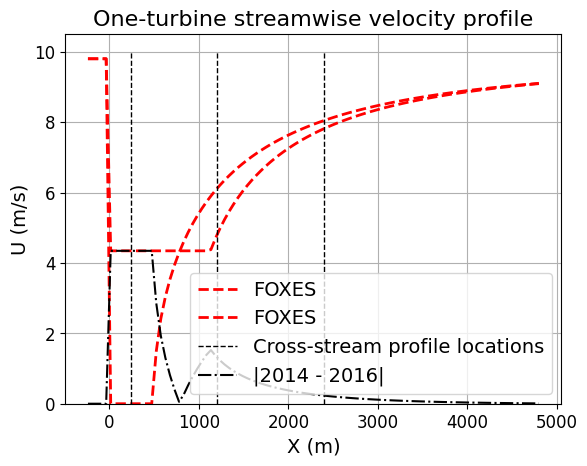
Bonus - Bastankhah 2014 vs Bastankhah 2016 in FOXES#
this_case = CASE_DIR / Path('bastankhah2014/wind_energy_system.yaml')
foxes_b2014 = WCompFoxes(this_case)
this_case = CASE_DIR / Path('bastankhah2016/wind_energy_system.yaml')
foxes_b2016 = WCompFoxes(this_case)
fig, ax = plt.subplots()
foxes_b2014.streamwise_profile_plot(wind_direction=270, y_coordinate=0.0, xmin=XMIN, xmax=XMAX)
foxes_b2016.streamwise_profile_plot(wind_direction=270, y_coordinate=0.0, xmin=XMIN, xmax=XMAX)
ax.plot([1*ROTOR_D, 1*ROTOR_D], [0, 10], color="black", linestyle='--', linewidth=PROFILE_LINEWIDTH)
ax.plot([5*ROTOR_D, 5*ROTOR_D], [0, 10], color="black", linestyle='--', linewidth=PROFILE_LINEWIDTH)
ax.plot([10*ROTOR_D, 10*ROTOR_D], [0, 10], color="black", linestyle='--', linewidth=PROFILE_LINEWIDTH, label="Cross-stream profile locations")
lines = ax.lines
x1, y1 = lines[0].get_data()
x2, y2 = lines[1].get_data()
e1 = np.abs(y1 - y2)
emax = np.max([np.max(e1), np.max(e2)])
ax.plot(x1, e1, color="black", linestyle='-.', linewidth=ERROR_LINEWIDTH, label="|2014 - 2016|")
ax.set_title("One-turbine streamwise velocity profile")
ax.set_xlabel("X (m)")
ax.set_ylabel('U (m/s)')
ax.set_ybound(lower=0.0)
ax.legend()
ax.grid()
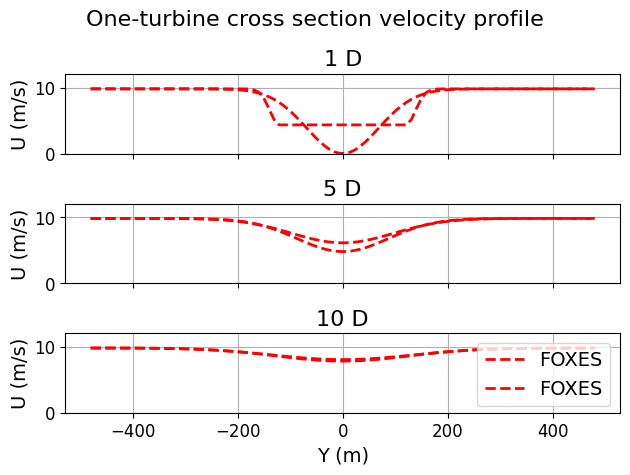
fig, ax = plt.subplots(3, 1)
fig.suptitle("One-turbine cross section velocity profile")
X_D = [1, 5, 10]
for i, D_X in enumerate(X_D):
plt.axes(ax[i])
foxes_b2014.xsection_profile_plot(wind_direction=270, x_coordinate=D_X * ROTOR_D, ymin=YMIN, ymax=YMAX)
foxes_b2016.xsection_profile_plot(wind_direction=270, x_coordinate=D_X * ROTOR_D, ymin=YMIN, ymax=YMAX)
ax[i].set_title(f"{D_X} D")
ax[i].set_ylabel("U (m/s)")
ax[i].set_ybound(lower=0.0, upper=12.0)
ax[i].grid()
if i < len(X_D) - 1:
ax[i].xaxis.set_ticklabels([])
else:
ax[i].set_xlabel("Y (m)")
ax[i].legend()
fig.tight_layout()
Turbine 0, T0: windio_turbine
Turbine 0, T0: windio_turbine